Building a UTS Environment in Northern Virginia With Open Source Data
Learn how to build a Ubiquitous Technical Surveillance (UTS) environment using open-source tools, traffic cameras, and live bus data with geofencing and alerts.
TL;DR: This post shows how open-source tools and public data can be fused into a working Ubiquitous Technical Surveillance (UTS) prototype. By combining Virginia Department of Transportation (VDOT) traffic camera network with the Fairfax Connector’s live bus feed, I built a mini UTS environment that demonstrates geofencing, alerting, and real-time tipping and cueing — the same mechanics Mexican Cartels and governments use at scale.
Introduction
So, what exactly is Ubiquitous Technical Surveillance (UTS)? To put it simply, its the widespread collection of data and the analytics that connect people or things to events and locations.
Think of it as five overlapping streams of data that, together, paint a near-total picture of someone’s life:
🔭 Visual/Physical — cameras or direct observation tying objects/people to places.
🛜 Electronic Signals — emissions from phones, radios, Wi-Fi, GPS, etc.
💵 Financial — credit card swipes, account transfers.
✈️ Travel — movement records such as tolls, border crossings, and bookings.
💻 Online — what we post, click, and search.
In this post, we’ll zero in on two of the five Ubiquitous Technical Surveillance threat vectors: Visual/Physical and Electronic Signals slices. More importantly, we’ll look at how fusing them together multiplies their power. A camera alone just shows a person. A signal alone just shows a device. But link the two, and suddenly you have confirmation: this phone belongs to that person, at this place, at this time.
Real-World Ubiquitous Technical Surveillance Examples:
- London ULEZ - ALPR cameras track vehicles and check them against compliance databases.
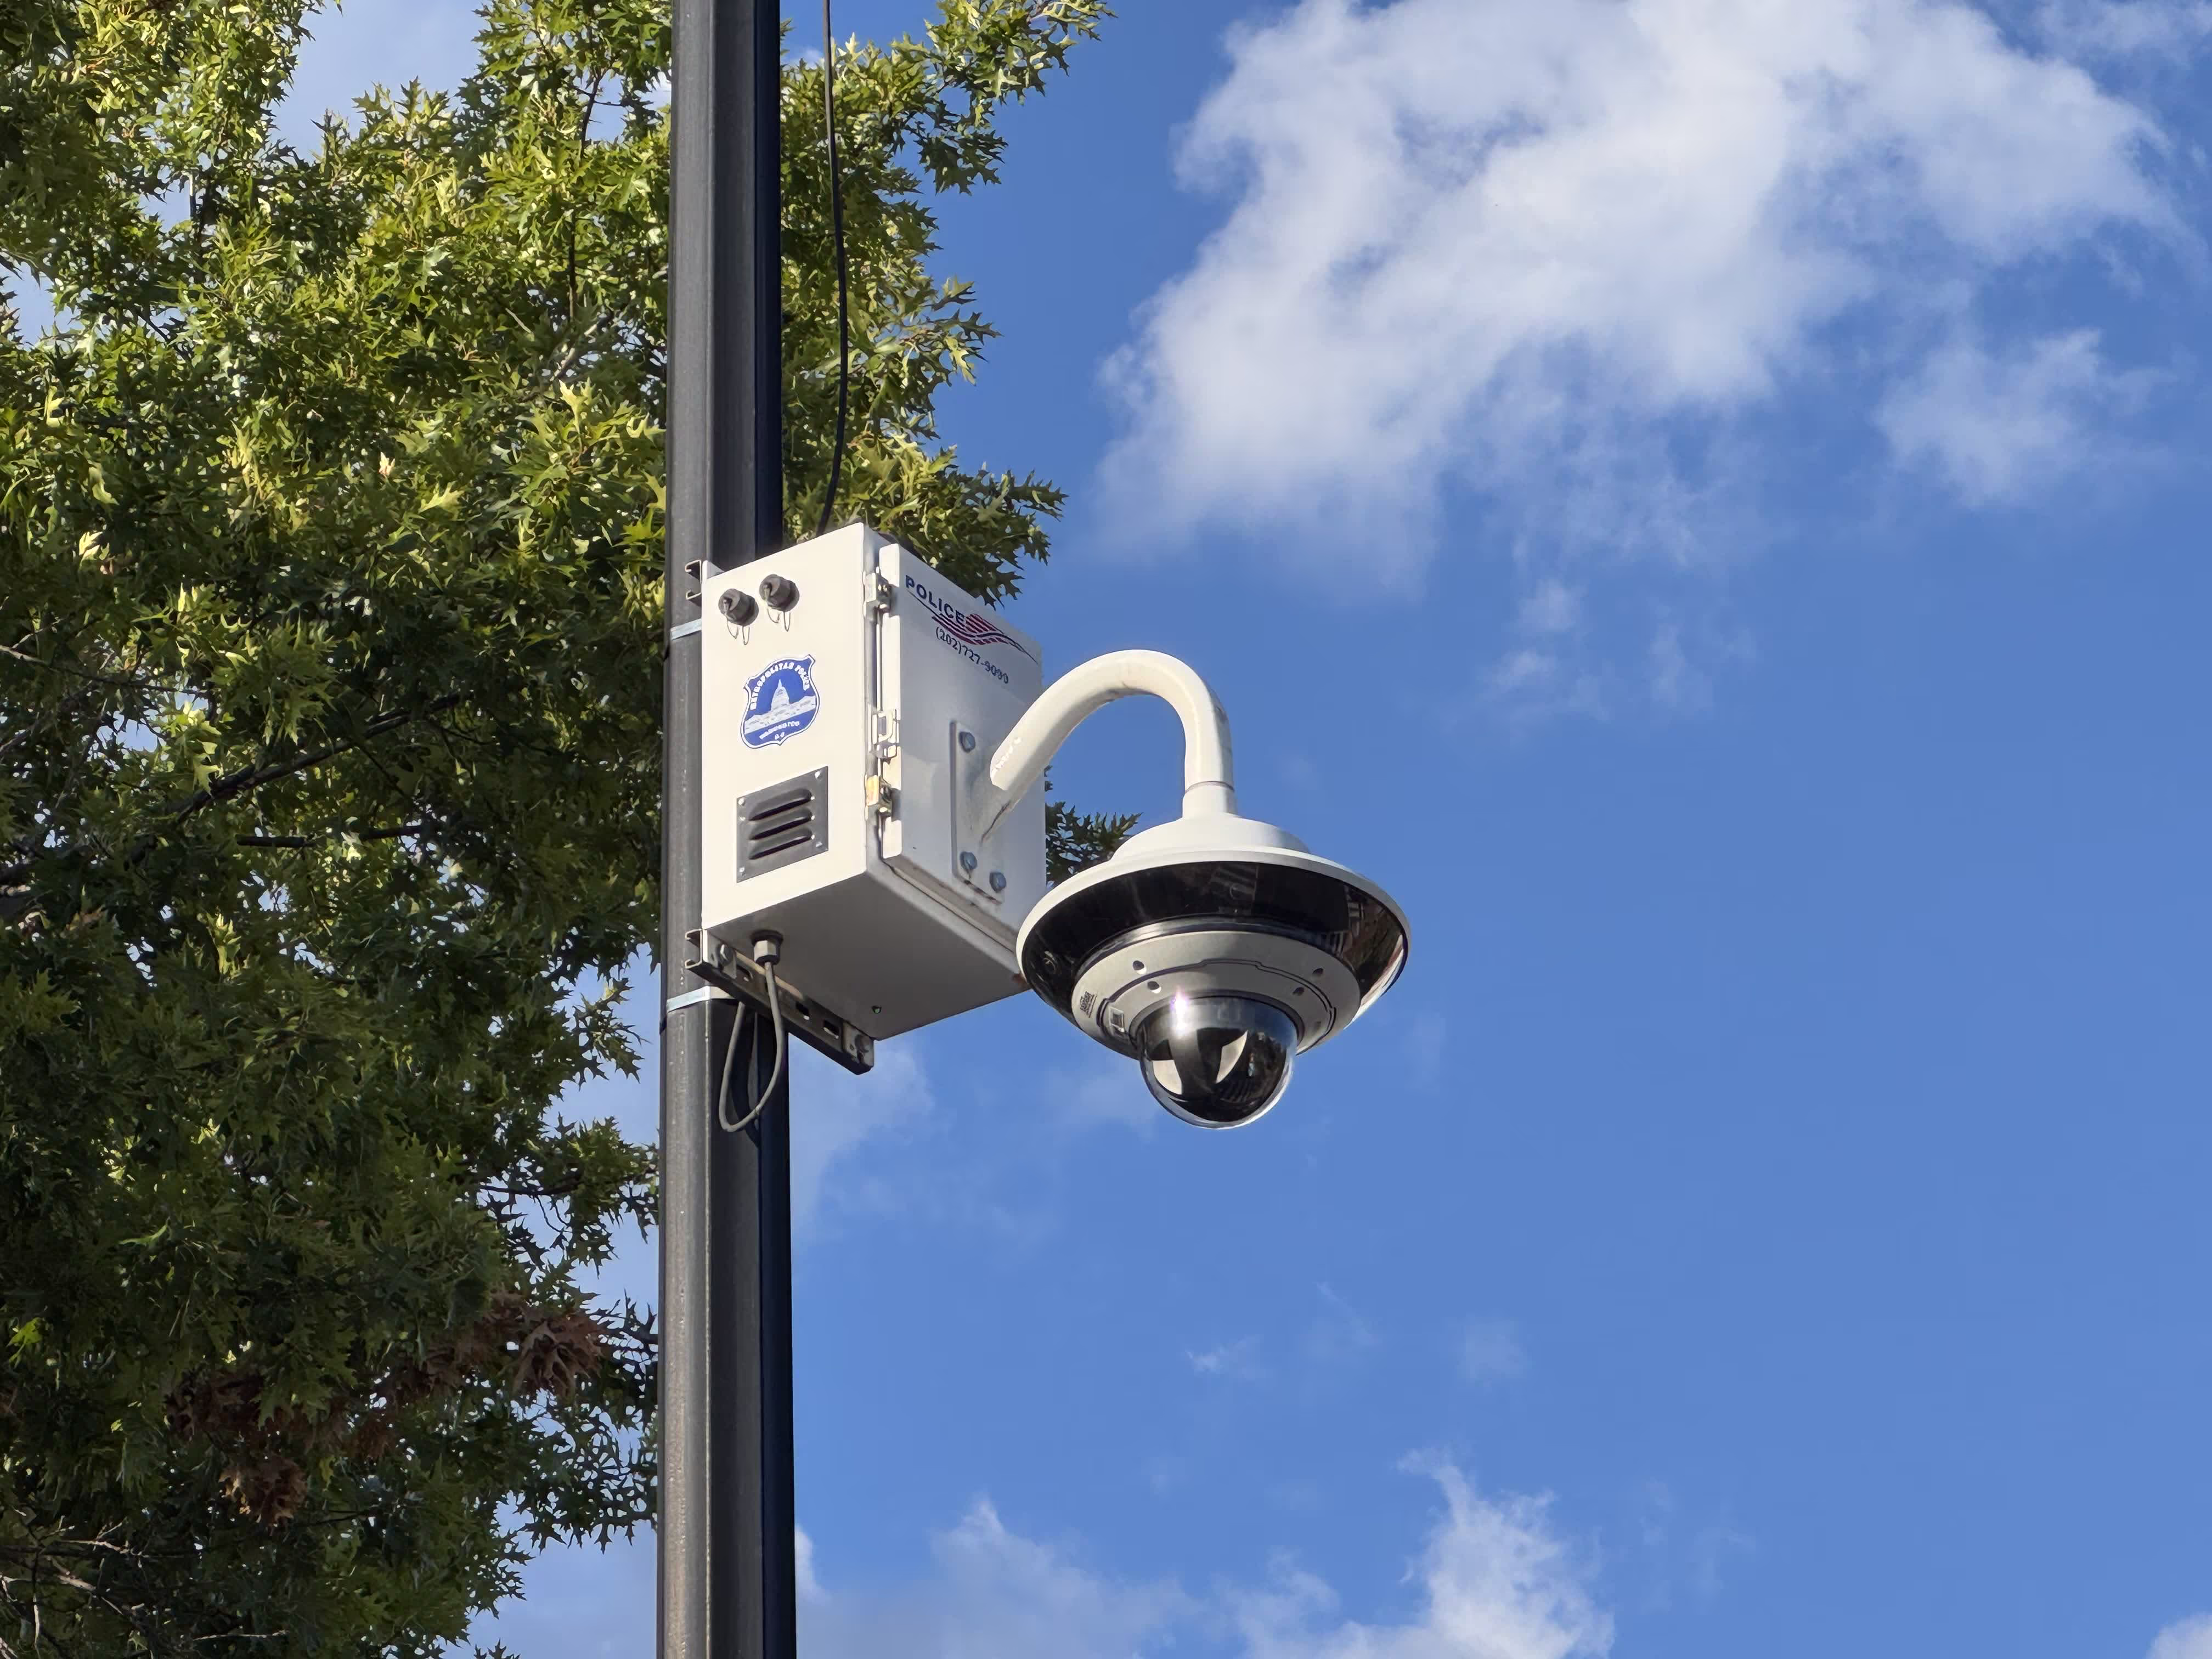
- CameraConnect DC / CapitalShield - residents and businesses share feeds with the DC Metropolitan Police for faster crime response.
- China CCTV (SkyNet) - 200M cameras integrated with facial recognition for mass monitoring.
And UTS isn’t just in the hands of governments. According to an FBI OIG report, the Sinaloa Cartel weaponized Ubiquitous Technical Surveillance techniques as early as 2018.
In 2018, while the FBI was working on the “El Chapo” case, an individual connected to the cartel said the group had hired a hacker who offered a menu of services to exploit mobile phones and other electronic devices.
The hacker observed people entering and leaving the U.S. Embassy in Mexico City and identified “people of interest” for the cartel, including the FBI Assistant Legal Attaché (ALAT).
Using the ALAT’s mobile phone number, the hacker accessed calls made and received, as well as geolocation data. He also compromised Mexico City’s camera system, followed the ALAT through the city, and identified associates the ALAT met with.
According to the case agent, the cartel used that information to intimidate and, in some cases, kill potential sources or cooperating witnesses.
This case is a sobering reminder: UTS is not hypothetical. It’s here, it’s operational, and it’s already being exploited by adversaries.
Finding Ubiquitous Technical Surveillance Data Sources
The first question in building a UTS environment is: where do you get the data? If you don’t already run your own networks, the answer can be tough. Some slices of UTS, such as Financial or Travel records, are basically unattainable unless you wield nation state powers or a hacker who just doesn’t care, but some are hiding in plain sight.
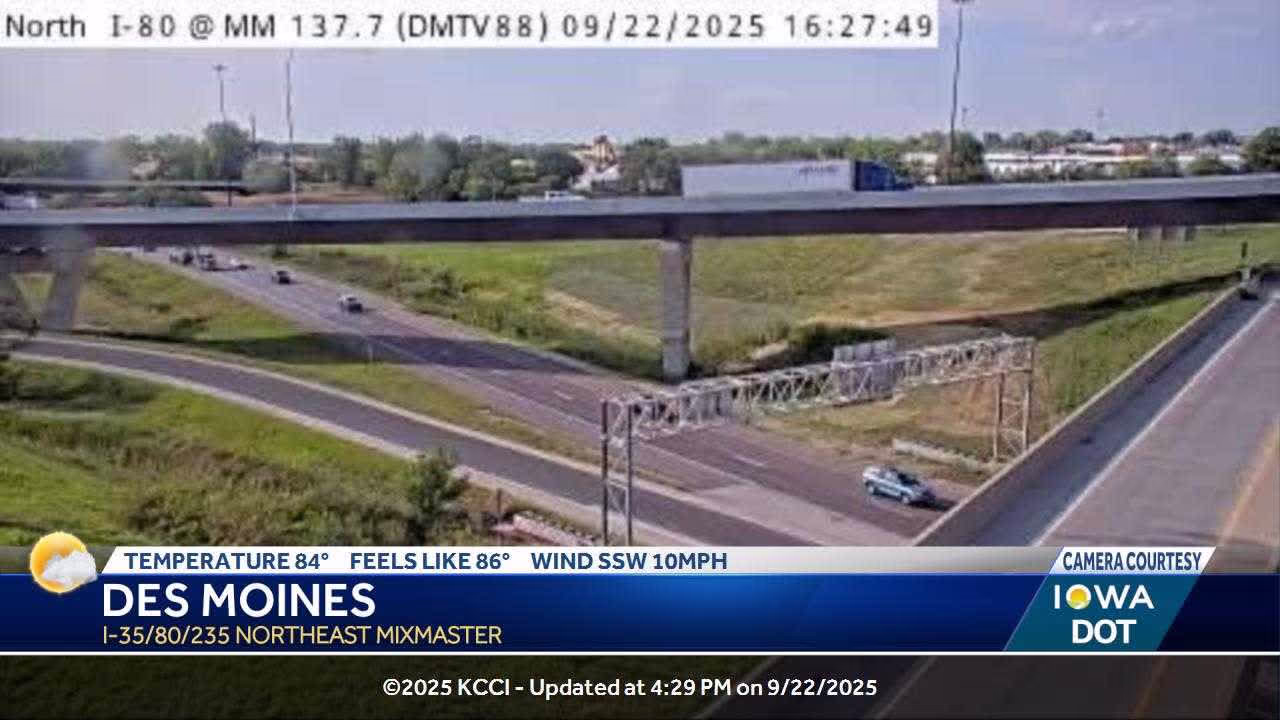
Take the Virginia Department of Transportation (VDOT) camera system. To most people, it’s just what the evening news uses to show traffic backups. To us, it’s an existing way to connect a physical place with a digital signal. Thousands of eyes on the road, open to anyone. Of course, there are limitations. Public traffic cameras are stream-only (no playback) and there are too many to process at once. Still, it’s a great starting point for the Visual/Physical slice.
That leaves the Electronic Signals slice. For that, we can lean on the Fairfax Connector’s live GTFS-RT feed. Every bus is a moving beacon, broadcasting its GPS coordinates. 76 buses, 24/7, crossing the same roads covered by VDOT’s 1,000+ cameras.
If I wanted to work really hard at this, I could spin up an instance of the self-hosted gps tracking tool, traccar, on my friends personal devices. But honestly, it’s more work than necessary and less realistic. The bus fleet gives me scale with dozens of moving signals against a thousand cameras.
Camera Feeds
From the VDOT GeoJSON dataset, we can ingest and visualize 1,390 cameras. Here’s a code snippet:
{
"properties": {
"rtsp_url": "rtsp://media-sfs8.vdotcameras.com:554/rtplive/FairfaxCCTV4055",
"problem_stream": false,
"active": true,
"route": "I-95",
"direction": "NB",
"https_url": "https://media-sfs8.vdotcameras.com:443/rtplive/FairfaxCCTV4055/playlist.m3u8",
"distance": null,
"preroll_url": "https://media-sfs8.vdotcameras.com:443/preroll/FairfaxCCTV4055/playlist.m3u8",
"rtmp_url": "rtmp://media-sfs8.vdotcameras.com:1935/rtplive/FairfaxCCTV4055",
"jurisdiction": "Fairfax",
"deviceid": 0,
"ios_url": "https://media-sfs8.vdotcameras.com:443/rtplive/FairfaxCCTV4055/playlist.m3u8",
"id": "592",
"clsps_url": "clsps://media-sfs8.vdotcameras.com:443/FairfaxCCTV4055",
"mrm": 129,
"description": "I-95 / MM 129 / NB",
"image_url": "https://snapshot.vdotcameras.com/thumbs/FairfaxCCTV4055.flv.png",
"name": "FairfaxCCTV4055"
},
"type": "Feature",
"geometry": {
"type": "Point",
"coordinates": [
-77.51187,
38.2769
]
}
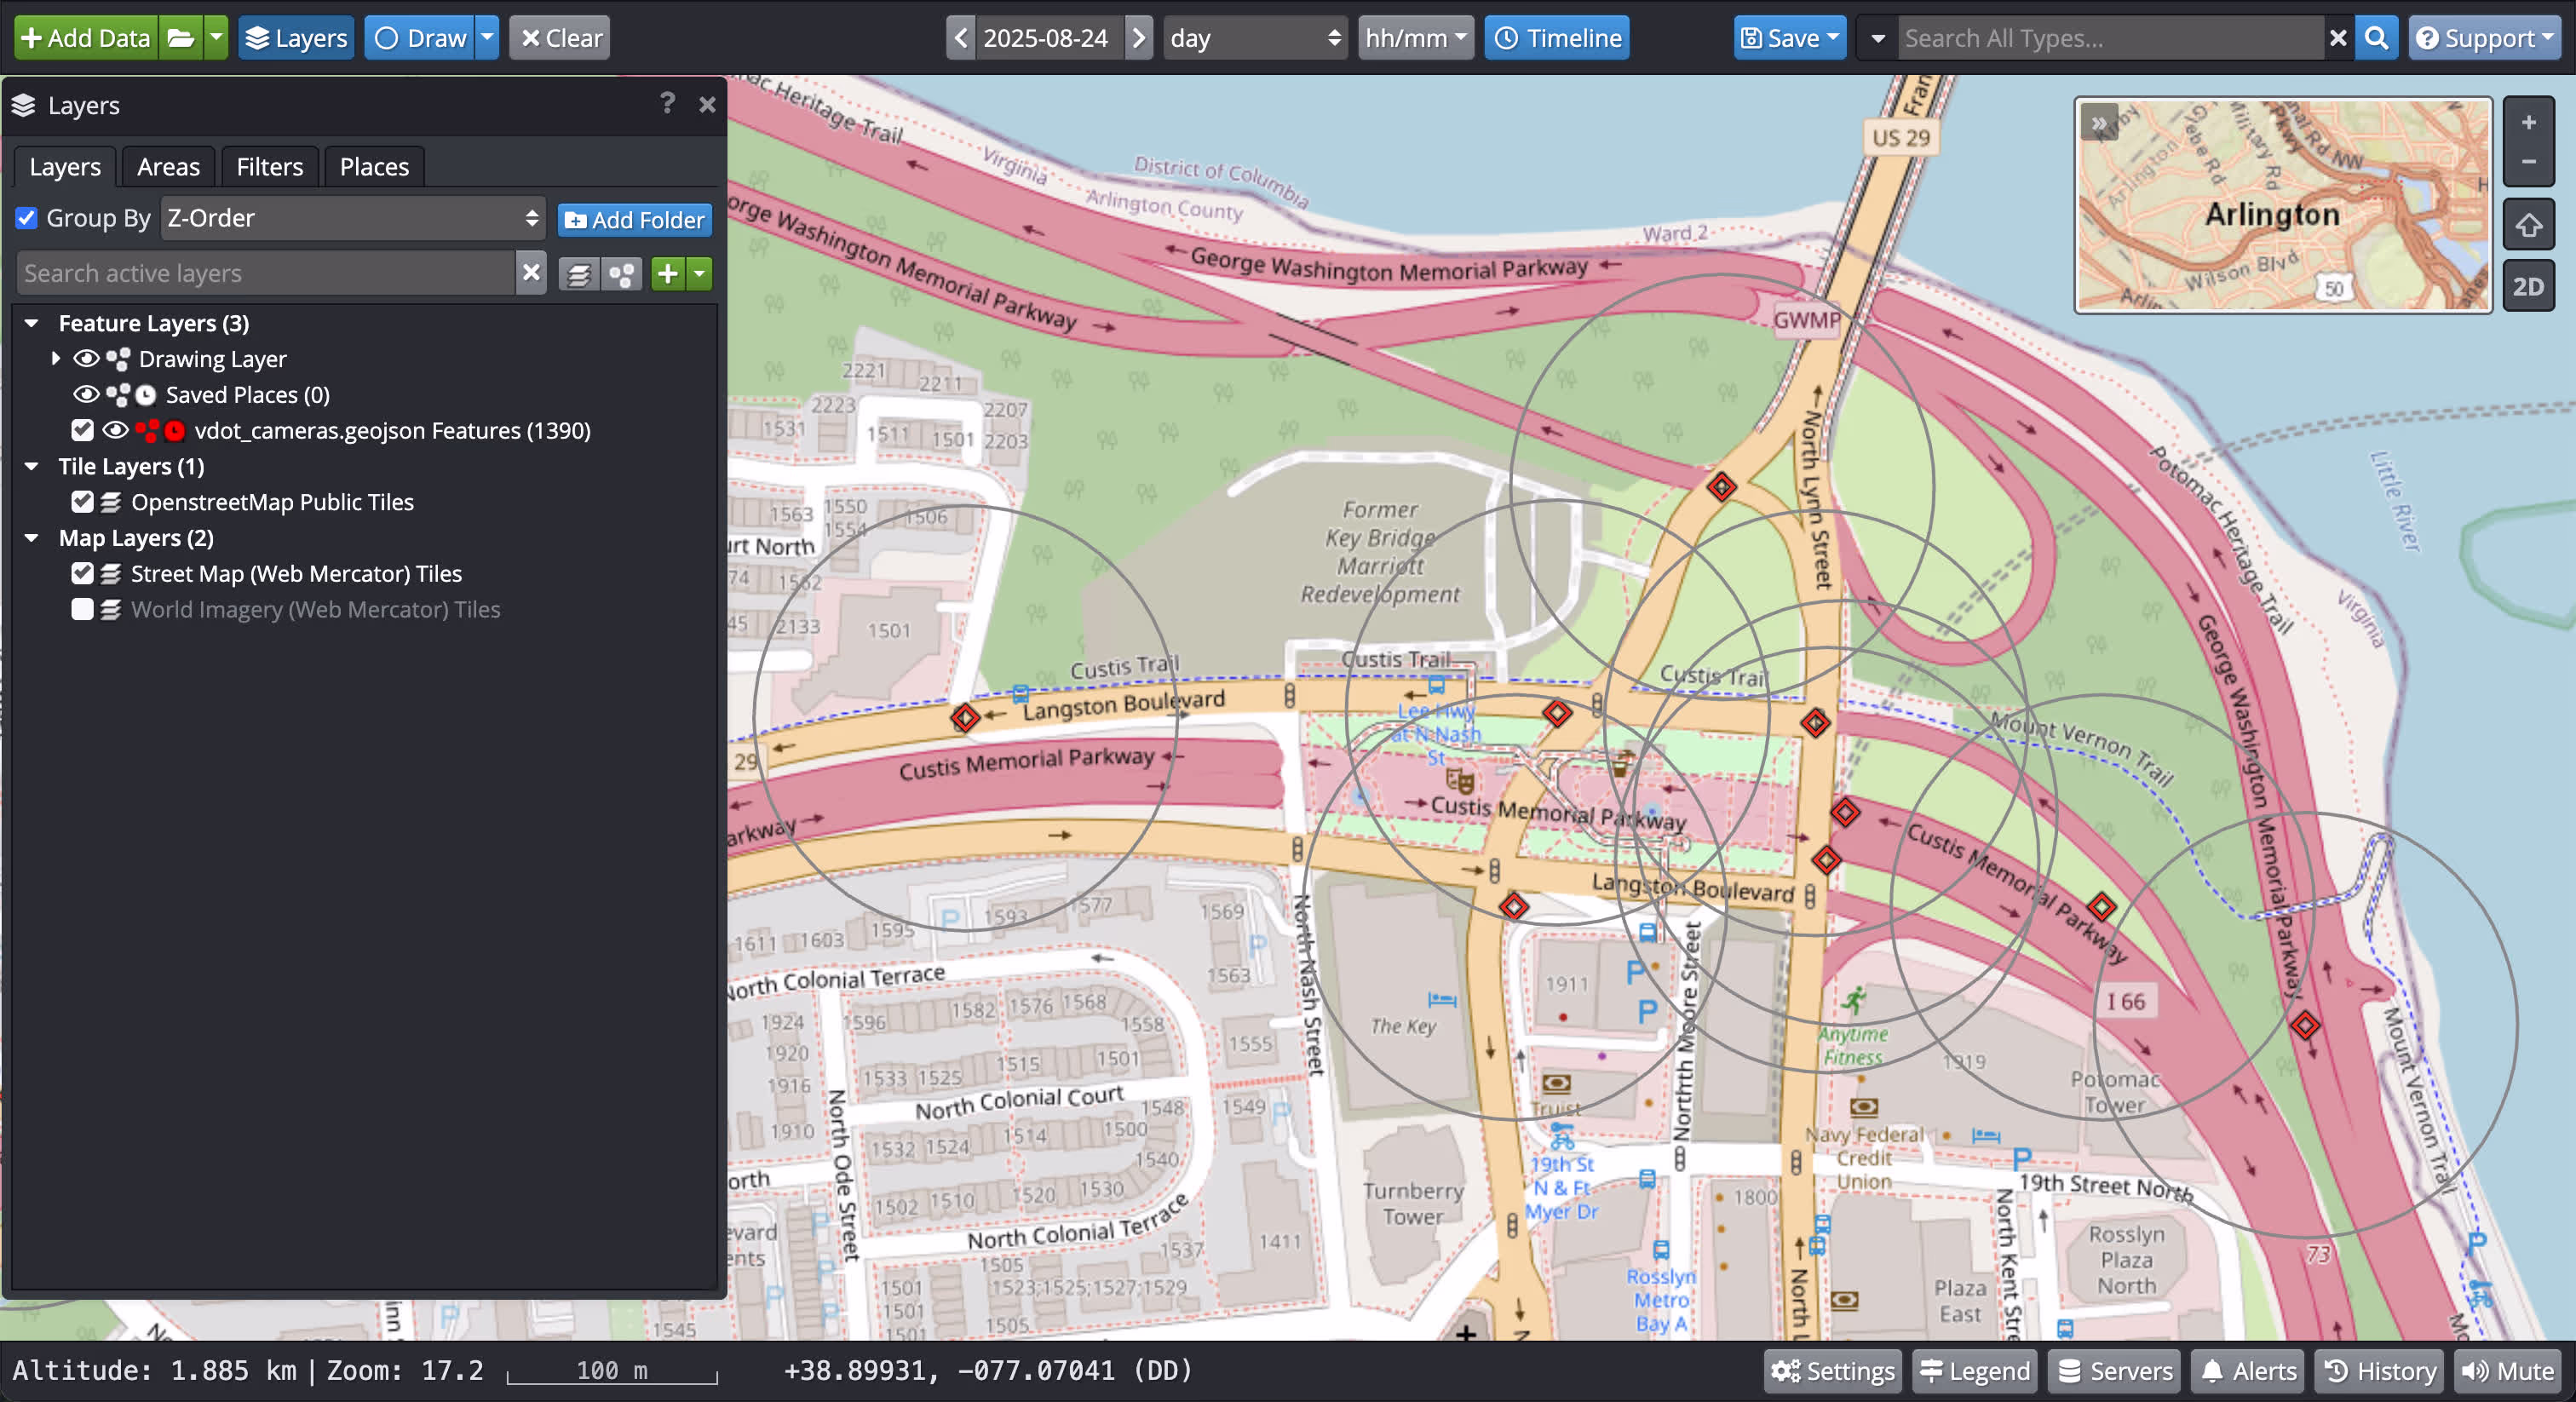
}As you can see we have a ton of good properties here that are provided to us. Different streaming formats, descriptions and most importantly the Point geometry for where this camera is located. We’ll use these features to plot coverage with OpenSphere, an extremely versatile open-source National Geospatial-Intelligence Agency project.
Coverage is dense along Virginia’s major roadways, with strong clusters in the Arlington/Fairfax region — exactly where our electronic signals will originate.
Electronic Signals
Our electronic signals come from the Fairfax Connector’s GTFS-RT feed, which tracks 76 operational buses in real time. I won’t go into the details of processing the feed here, but you can read more about the GTFS real-time specification. At a high level, each bus record looks like this:
FeedEntity {
  id: '76',
  vehicle: VehiclePosition {
    multiCarriageDetails: [],
     trip: TripDescriptor {
      tripId: '8606010',
      scheduleRelationship: 0,
      routeId: '171'

    },
    position: Position {
      latitude: 38.72197341918945,
      longitude: -77.18866729736328,
      bearing: 53,
      speed: 17.434558868408203
    },
    timestamp: Long { low: 1756051300, high: 0, unsigned: true },
    vehicle: VehicleDescriptor { id: '7948' }
  }
}
Bingo! The real prize here is having a consistent stream with the latitude/longitude. By pulling the feed at set intervals, we can watch buses move across a live map in near real time. Each dot becomes a signal we can cue against a camera, turning data into confirmation.
Put those moving signals together with 1,000 fixed cameras around Virginia, and you’ve got the makings of a mini UTS environment.
Geofencing and Alerting
With our data streams in place, the next step is building a system that knows when to pay attention. In this case, we want to start surveillance on a bus when it gets near one of our cameras and begin recording.
Why not just record everything all the time? At scale, that’s not practical! Storage fills up fast, analysts drown in noise, and most of the footage is irrelevant. The key is to filter for the moments that matter.
That’s where geofencing comes in. At its simplest it works like an if then rule. When X happens you do Y. In this test the rule is that when a bus comes within 100 meters of a stationary camera the system starts recording and alerts the user.
For this demo, we’ve set a 100m geofence for every camera. It’s a compromise — small enough to limit false events, but large enough to capture buses within a typical camera viewport traveling in either direction.
In urban areas, overlapping geofences highlight the messy reality: multiple cameras may trigger at once, but only a few will have usable video depending on angle, focus, or conditions. With richer metadata, you could design custom polygons per camera to cut down on false positives.
Here are a few examples of those challenges:
Unfocused camera
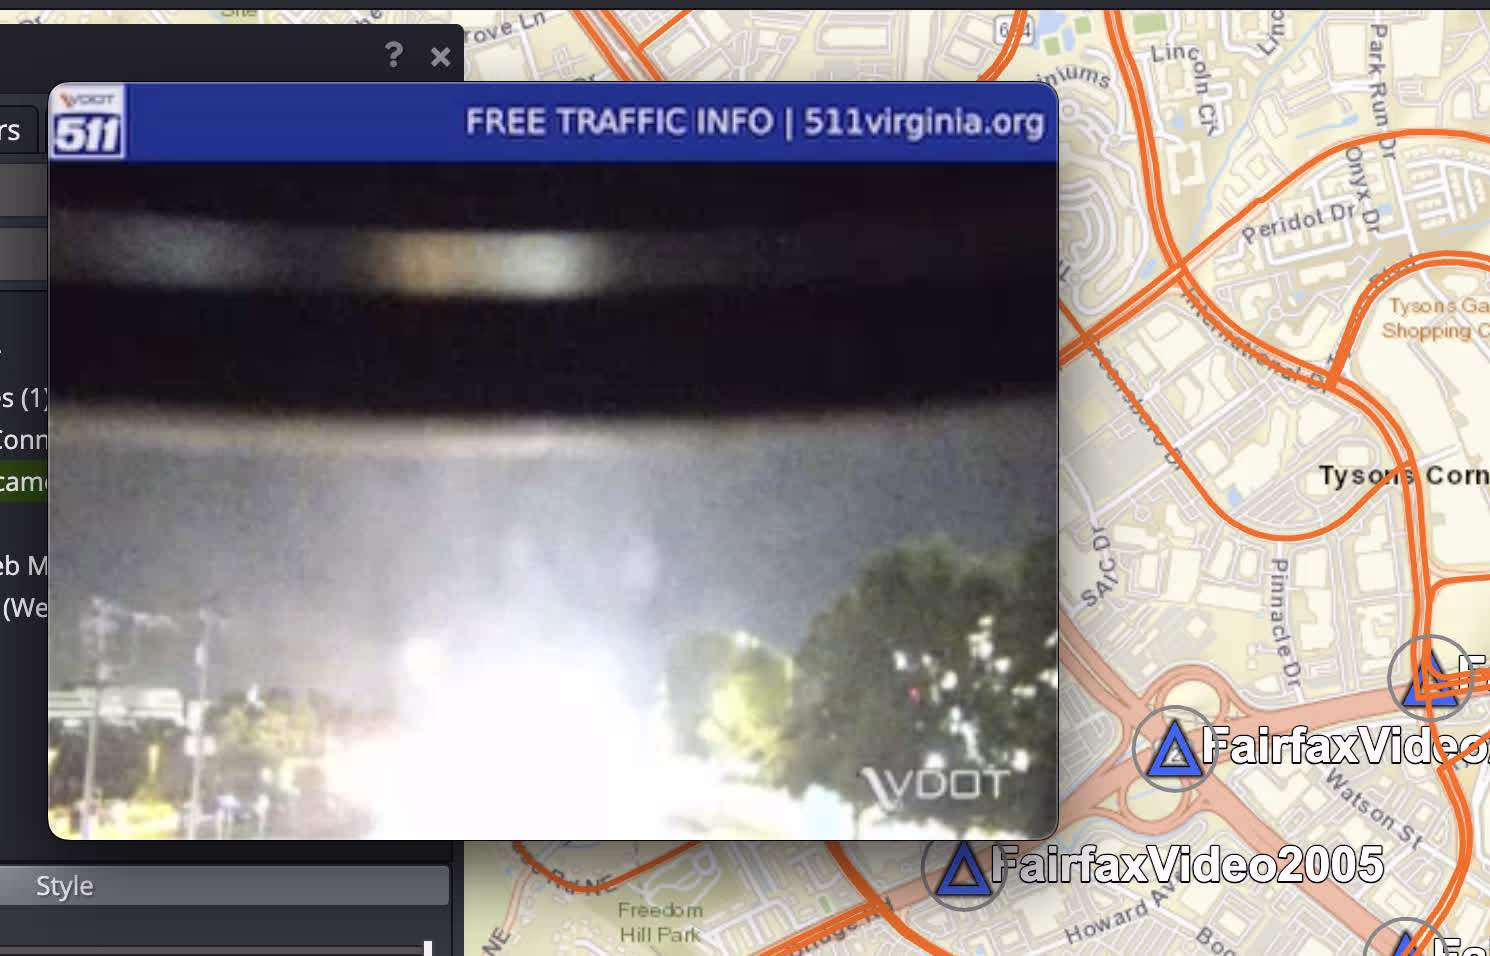
Camera with a narrow viewport pointed at a highway stretch but still triggering on side-street signals
Putting It All Together
For my project I built a custom connector to index the GTFS-RT stream every five seconds. There are plenty of other ways you could handle ingestion depending on your stack. The pipeline details aren’t the main point here. What matters is what happens once the data is fused.
For storage I used Redis. It holds both the current bus locations and the fixed camera locations, and it gives me a simple way to run geofence checks in real time. The key is making sure the data lives in something with a geospatial index. Postgres and MongoDB can do this as well. Without that support, point-in-polygon calculations quickly get expensive.
This approach isn’t limited to buses and traffic cameras. The ingestion pipelines I built can handle any type of geospatial stream — moving sensors, stationary emitters, or multi format live camera feeds. What I’ve shown here is just scratching the surface of what’s possible.
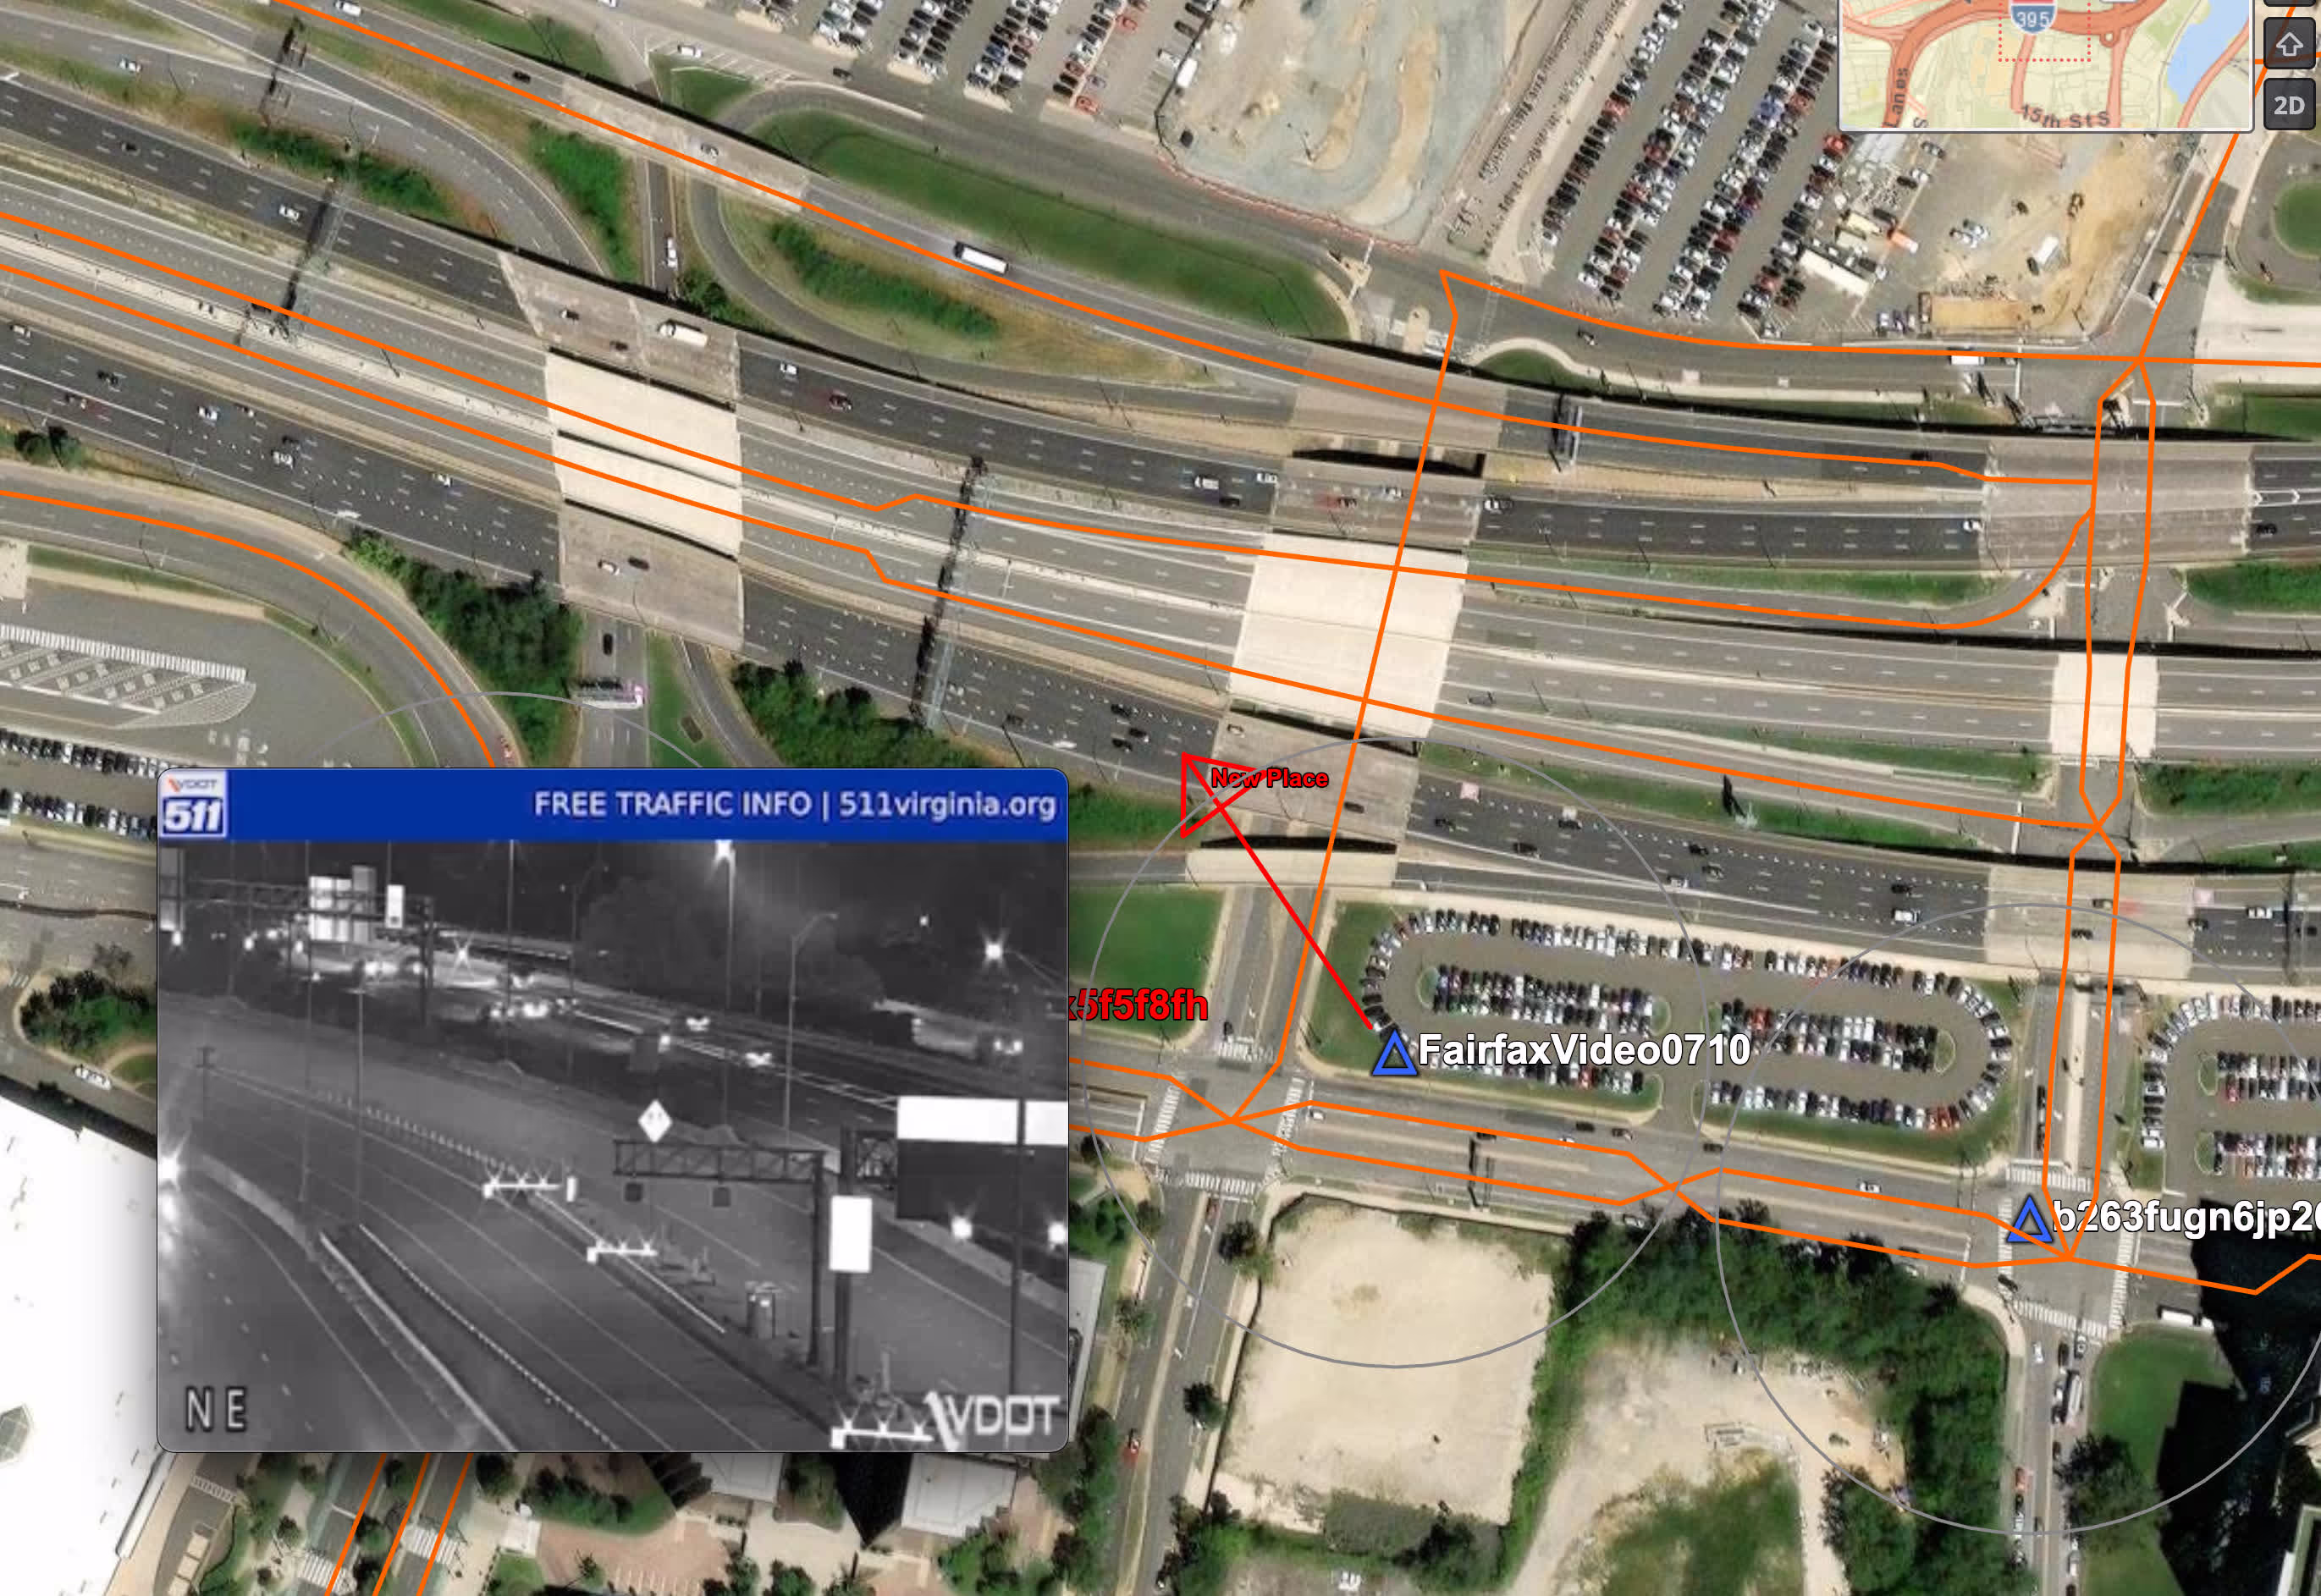
Once both datasets are flowing and indexed, we can see buses and cameras together on a single map. Each camera has its geofence, and buses update their position in near real time. When a bus crosses into a geofence, the system triggers a webhook and an event appears instantly in the UI.
On the right-hand video pane, you’ll see the camera feeds light up in real time. In the sample run below, notice how the first and second feeds briefly catch buses as they pass through. That’s tipping and cueing at work, and we caught bus 7716! Was bus 1734 trying to throw us off its trail? Was 1734 trained in Counter Surveillance? We may never know …
Next Steps: Supercharging the Prototype
Smarter Geofences: Right now, every camera has a basic 100-meter circle around it. That works for a demo, but it’s noisy. We can do better. By using the bus bearing from the GTFS feed, the system can predict direction of travel and only tip cameras in the bus’s path. Even more precise: replace circles with custom polygons based on actual camera viewports — angle, range, and field of view. That way, we’re only alerting when a bus is in line of sight.
Event Recording and Storage: Instead of passively watching alerts, we can capture and archive them. Each time a geofence triggers, the system could record a short video snippet from the relevant camera, then upload it to object storage (e.g., S3). With metadata tags like time, bus ID, and camera ID, you could quickly review or replay events. Over time, this builds a searchable library of “signal-to-visual” matches.
Analytics Layer: Once alerts are stored, we can start analyzing them. Heatmaps could show where signals and cameras overlap most often, identify chokepoints, or highlight times of day with frequent triggers. You could look for patterns, not just isolated events — the kind of insight that makes surveillance scalable.
More Sensors: The buses were just a stand-in for moving signals. In a real deployment, you could plug in your own network of emitters. Tire pressure monitoring systems (TPMS), Bluetooth beacons, and radio frequencies are all examples of low-cost signals that can be harvested and fused with camera coverage.
Work With Me
This demo scratches the surface. If your organization needs a UTS prototype tailored to your data and sensor environment, I can help. I specialize in designing and delivering working prototypes through short, focused sprints. Reach out and let’s explore what that could look like for you.
This post was originally published on LinkedIn.